Implementing SonarQube code coverage in a simple JavaScript application
A high-level review of code coverage. Additionally, you will learn how to use the popular code coverage tool SonarQube using a simple JavaScript application.

Everyone knows that a lack of test coverage for some areas of our code can result in production-related flaws.
A class, module, function, or a few lines of code can be difficult to find manually, and doing so is almost always expensive. The alternative? Use an automated and straightforward approach thanks to code coverage tools.
Coverage tools evaluate your code to determine which portions have been called from tests by running profilers on our systems. This analysis provides us with a global percentage of the code covered. The lower the percentage, the less likely there will be production flaws.
In this article, you will gain a high-level understanding of code coverage. Additionally, you will learn how to use the popular code coverage tool SonarQube to enhance applications. Here we will be using a simple JavaScript application.

What is code coverage?
Code coverage, often known as test coverage, is the proportion of the application’s code that has been run during testing. It basically measures the percentage of production code that has been tested and run, which is a metric that many teams use to assess the efficacy of their tests.
This gives assurance to the programming teams that their programs have been thoroughly tested for bugs and should be substantially error-free.
Here are some of code coverage’s advantages:
- Identify the overlooked code execution routes
- Good, tested code is indicated by high code coverage
- Promotes the use of code coverage principles while developing unit tests
- High code coverage increases programmers’ confidence
- Determine whether sections of the code have undergone testing and which have not
- For the best speed, code coverage may call for some rewriting
SonarQube overview
A Java-based open-source tool is called SonarQube. It enables us to do code coverage and static code analysis to evaluate the reliability and security of a program. With SonarQube, development teams may use fully customizable reports and a dashboard to show the quality of the code in their apps.
This program can analyze the static code of more than 25 languages, including PHP: Hypertext Preprocessor (PHP), Java,.NET, JavaScript, Python, and others. For a complete list, go to the SonarQube docs.
SonarQube also provides code analysis for security issues, code smells, and code duplication, as well as code coverage for unit tests.
Test coverage overview with SonarQube
Again, looking at test coverage statistics and test execution reports will show you how much of your code is covered by your test cases.
SonarQube cannot determine coverage by itself. To include coverage findings in your study, you must set up a third-party coverage tool and configure SonarQube to import the data produced by that tool. The right SonarScanner configuration is required in order to integrate code analysis into your build procedure.
Getting started with SonarQube code coverage using JavaScript
Prerequisites:
Before attempting to follow along, you should have the following installed on your system:
- NodeJS: NodeJS runtime enables us to power our JavaScript application. You can find its installation method from the link.
- Docker: We will use the lightweight SonarQube image to run our instance locally, hence the need to have docker running on your system.
- A text editor or IDE: For the purpose of this article, Visual Studio Code (VS Code) which can be downloaded here will be used.
How to install SonarQube:
SonarQube must be run on servers or virtual machines because it is an on-premise solution (VMs). Without having to explicitly configure the server on your system, starting up an instance can be replaced by installing a Docker container from the Sonar image.
From your terminal, run the following command:
docker run -d --name sonarqube -p 9000:9000 sonarqube:latest
docker rundownloads thesonarqube:latestversion from Docker hub if not already on your system.- The –name gives the image a name, in this case, it’s
sonarqube - The -p tag opens your localhost port to that of the sonarqube image. in our case, we are mapping port 9000 locally to 9000 of the image.
- Once your instance is up and running, you can log in and access the sonarqube instance from your local browser through
http://localhost:9000using System Administrator default credentials.- login: admin
- password: admin
- Once your instance is up and running, you can log in and access the sonarqube instance from your local browser through

How to create a new project with SonarQube:
You will require a dashboard for the test results if you run your coverage or static code analysis tests locally or through some form of pipeline. The SonarQube projects have a role in this. The test output and outcomes are uploaded to a SonarQube project.
Choose Project Type
When you initially log into the SonarQube instance to start a new project, a page similar to the one below will be presented.
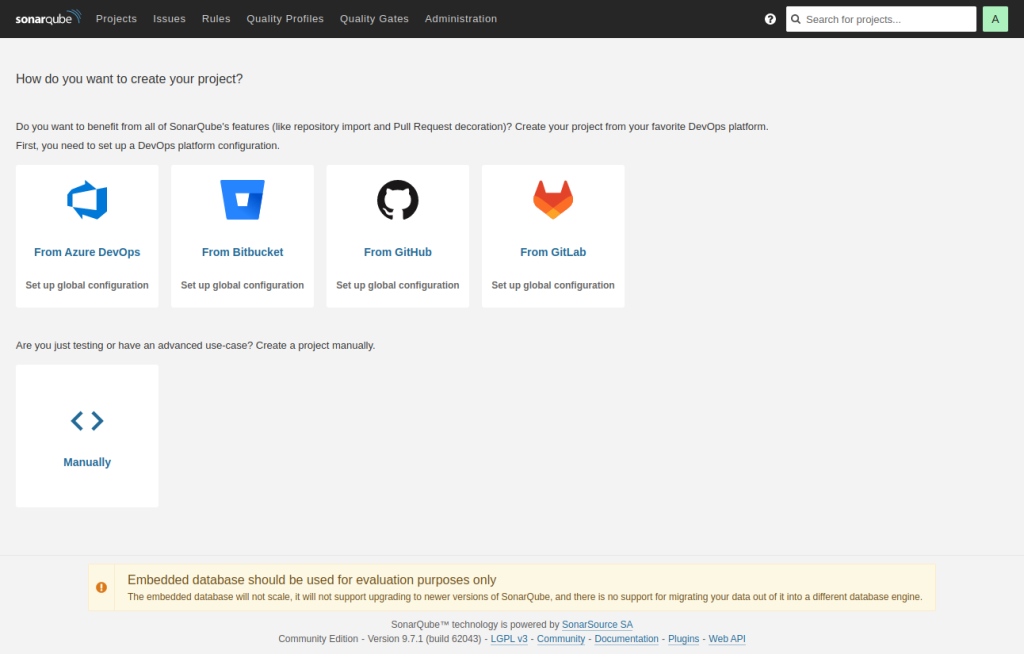
Click Manually since we will be setting up the project manually rather than using a pipeline for the sake of simplicity.
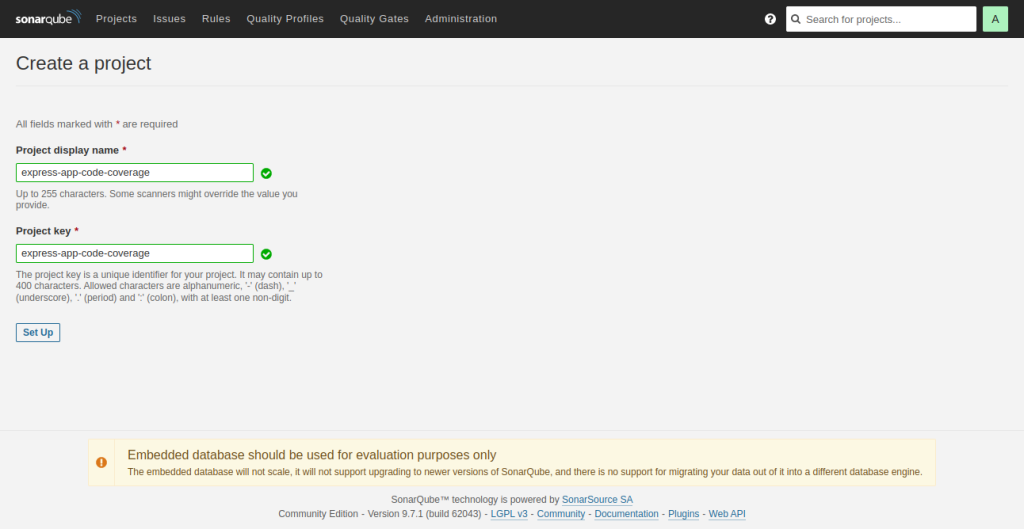
Create Project Key and Name
The project key you create next will be used later on as a property in our NodeJS application.
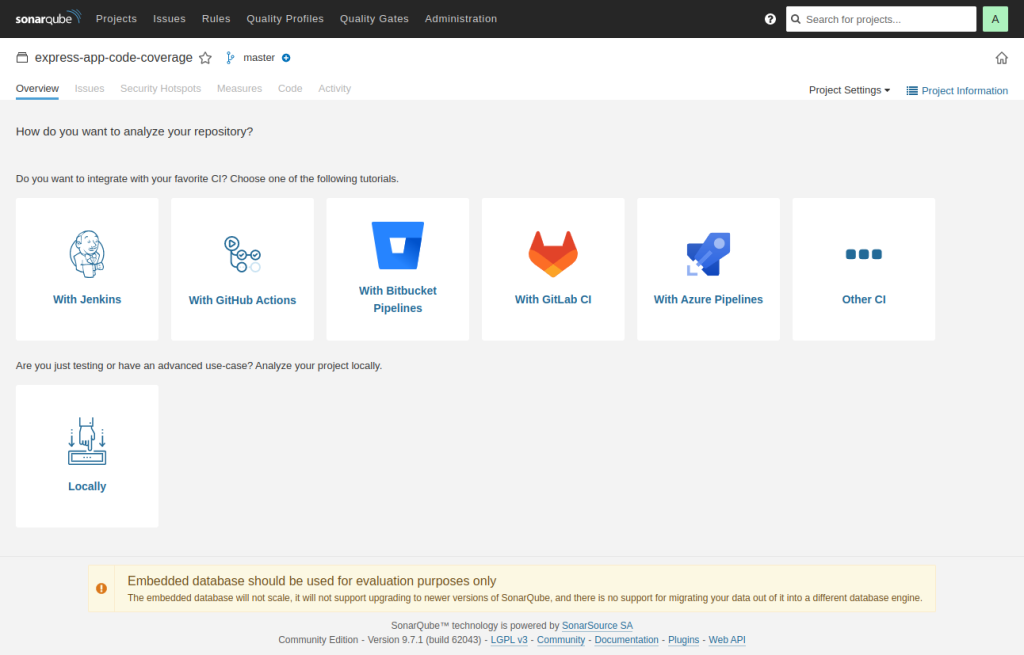
Configure SonarQube repository analysis
Next To set up the SonarQube repository, click the “Set Up” option. This aids in deciding how to publish and use SonarQube to analyze your test results. We shall once more analyze our project locally. Therefore, select Locally.
Generate Project Token and Project Analysis
The next step is to create a token. While running SonarQube tests, you can use this token to log in locally.
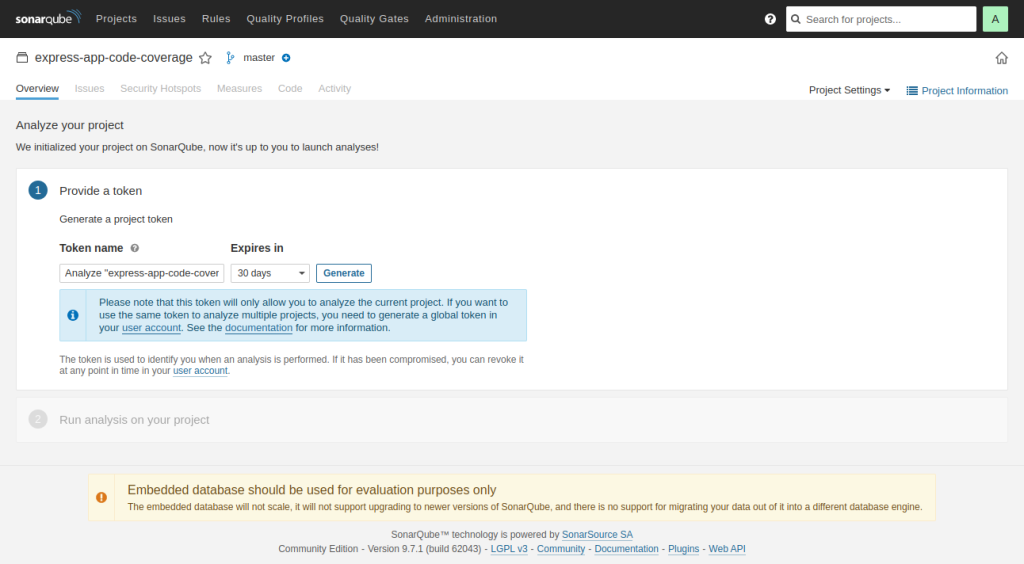
This will create a token, which you should secure and save. This will be put to use later when we configure our application for SonarQube.
Select Other (for JS, TS, Go, Python, PHP, etc.) next since that best describes our build, which consists of JS and the OS as shown below.

We will come back to this dashboard but let’s first install SonarScanner to have full control when configuring our applications.
How to install SonarScanner:
SonarScanner is the command-line tool that you will use to run SonarQube tests. The tests send results to the SonarQube server so you can view them.
To install SonarScanner open up a web browser and go here.
Choose which operating system you are running and download the SonarScanner zip.

Save the download to a location after unzipping it. Include the SonarScanner “bin” directory in the $PATH environment variable for your operating system.
You will find the program in the bin directory and that’s where the $PATH needs to point so you can run sonar-scanner directly from your terminal.
To test if your installation was successful, run sonar-scanner from your terminal.
Another method to install SonarScanner is through Docker. Learn more here.
Setup the NodeJS application
We will be using a simple express server as our sample.
Run the following to start and set up a node project
npm init -y
Next, we need to install some dependencies that enable sonaqube to test and scan our application.
npm install jest @types/jest express supertest --dev
- Jest is a test/coverage tool
- Express is a NodeJS framework for building a robust server-side web application
- Also, we installed Jest types for better code completion as all major IDEs support it
Folders/files structure
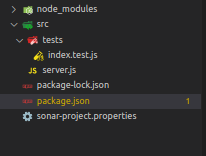
Application setup
First, we will set up a simple server that listen at a port 3000 locally with express, in the server.js file, add the following code:
src/server.js
const express =  require('express');
const app =  express();
const port =  8080

app.get('/', (req, res) => {
    return res.status(200).json({
      nome:  'Learn SonarQube code coverage',
      status: true
    });
});

let server = app.listen(port, () => {
    console.log(`Application server running on ${port}`);
});

module.exports  = server;
Before we run our code, let’s extend the package.json scripts, jest, and jestSonar.
...
 "scripts": {
    "start:dev": "node src/server.js",
    "test:dev": "jest --coverage"
  },
  "jest": {
    "testEnvironment":  "node",
    "coveragePathIgnorePatterns": [
        "/node_modules/"
    ],
    "testResultsProcessor":  "jest-sonar-reporter"
  },
  "jestSonar": {
    "reportPath":  "coverage",
    "reportFile":  "test-reporter.xml",
    "indent":  2
  },
...- Notice the scripts, we added three key-values pair, which are
- start:dev – To start our express server locally in development mode.
- test:dev – This uses jest to test our application with an extra flag
--coverageto cover and report the application test coverage.
- The jest properties were extended to include
testEnvironmentand Path to ignore during test coverage while using thejest-sonar-reporter, a custom results processor for Jest astestResultsProcessor. Also the jestSonar properties were extended to include path and file of the sonar instance run.
Creating the test scripts
let write a test file first. In order to obtain the get request for route “/,” we will import the index.js file and supertest. it is ultimately essential to shut the open server connection.
src/tests/index.test.js
src/tests/index.test.js
const request = require('supertest')
const server = require('../server')
const app = request(server)
describe('Get Endpoints', () => {
it('Get', async () => {
const res = await app
.get('/')
.send({
name: 'test ran successfully',
});
expect(res.statusCode).toEqual(200);
expect(res.body).toHaveProperty('name');
expect(res.body).toHaveProperty('status');
})
})
afterAll(async () => {
server.close();
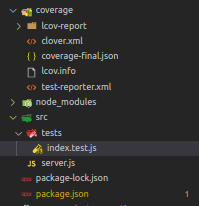
});Let’s run the command in order to conduct the test coverage. This will generate the coverage folder and files reports.
npm run test:dev

A folder called “coverage” will be created automatically upon the completion of all tests. Your test results and analyses are reported in this. SonarQube’s support for the LCOV report format is used by Jest.
How to configure SonarQube with our NodeJS Application
We will make a sonar-project.properties file and place it at the root of our project repository in order to set up SonarQube to work with our application via the sonar scanner. Configurations for logging in to our local SonarQube instance will be found in this file.
Add the following configurations properties to the sonar-project.properties
sonar.projectKey=express-app-code-coverage
sonar.host.url=http://localhost:9000
sonar.login=sqp_78079f58abf0016f7b46e999a1760e1578ba90a3
sonar.sources=src
sonar.test=src/test
sonar.test.inclusions=src/**/*.test.js

sonar.javascript.lcov.reportPaths=./coverage/lcov.info
sonar.testExecutionReportPaths=./coverage/test-reporter.xml
sonar.sourceEnconding=UTF-8- sonar.projectKey: We specify our project name here. Remember the name when creating SonarQube project earlier.
- sonar.host.url: Specify the SonarQube host, here we are using a localhost instance
- sonar.login: Add the token generated during the creation of SonarQube Project. This helps with authentication. (You should keep this token secret and protected from the public)
- sonar.sources: Specify our application source path.
- sonar.test and sonar.test.inclusions : Specify the test file’s location and inclusions format.
- sonar.javascript.lcov.reportPaths: This is a very important parameter that SonarScanner needs to get the test coverage report created by jest
--coverage. - sonar.testExecutionReportPaths: This specifies the test execution path also created during jest –coverage. The file
test-reporter.xmlwas generated due to the extended jest configurations added to our package.json.
The sonar-scanner command must then be executed in the project root terminal. (Recall that we already installed the SonarScanner.) Open the project folder in your terminal, or, if you’re using Visual Studio Code, open the integrated terminal and enter the following command:
sonar-scanner
According to our use case, this script reads/scans the sonar-project.properties files located in the project root and uploads them to a local SonarQube instance. If successful, a message similar to this should appear:

This command is in charge of committing SonarQube and running the pipeline. Return to your SonarQube instance dashboard now, and an automatic display of the following page will allow you to view your code coverage, static analysis, and other information.


100% test coverage simply implies that you have created enough tests to cover each and every line of code in your application. Nothing more or less, just that.
You can look through the dashboard to see further analyses. SonarQube enables you to report problems like bugs, vulnerabilities, tiny code, etc.

fin.
Aviator: Automate your cumbersome merge processes
Aviator automates tedious developer workflows by managing git Pull Requests (PRs) and continuous integration test (CI) runs to help your team avoid broken builds, streamline cumbersome merge processes, manage cross-PR dependencies, and handle flaky tests while maintaining their security compliance.
There are 4 key components to Aviator:
- MergeQueue – an automated queue that manages the merging workflow for your GitHub repository to help protect important branches from broken builds. The Aviator bot uses GitHub Labels to identify Pull Requests (PRs) that are ready to be merged, validates CI checks, processes semantic conflicts, and merges the PRs automatically.
- ChangeSets – workflows to synchronize validating and merging multiple PRs within the same repository or multiple repositories. Useful when your team often sees groups of related PRs that need to be merged together, or otherwise treated as a single broader unit of change.
- FlakyBot – a tool to automatically detect, take action on, and process results from flaky tests in your CI infrastructure.
- Stacked PRs CLI – a command line tool that helps developers manage cross-PR dependencies. This tool also automates syncing and merging of stacked PRs. Useful when your team wants to promote a culture of smaller, incremental PRs instead of large changes, or when your workflows involve keeping multiple, dependent PRs in sync.