
How to improve query performance in Prometheus with Cortex query frontend
In this article, we will explore ways to improve query performance in Prometheus using caching with Cortex query frontend.

Introduction
Prometheus and Grafana are powerful tools for monitoring and visualizing data. However, running queries against large datasets can sometimes be slow. Caching can help to improve query performance by storing the results of frequently-run queries in memory. This can significantly reduce the time it takes to load dashboards and view data.
In this article, we will explore ways to improve query performance in Prometheus using caching with Cortex query frontend.
Cortex query frontend is a proxy that sits between Grafana and Prometheus. It can be used to cache queries, as well as to provide other features like rate limiting and authentication.
Prerequisites
A Kubernetes cluster with Prometheus and Grafana installed
Install Cortex query frontend
Let’s start by installing Cortex query frontend by applying the manifest:
kubectl apply -f https://raw.githubusercontent.com/tanmay-bhat/query-frontend-demo/main/cortex-frontend-manifests.yamlThis will create a deployment, service, and configmap for Cortex query frontend in the default namespace.
Once the deployment is ready, add a new data source in Grafana with the Cortex query frontend URL as the endpoint. Since I’ve installed query frontend in the default namespace, the URL will be :
http://cortex-query-frontend.default:9092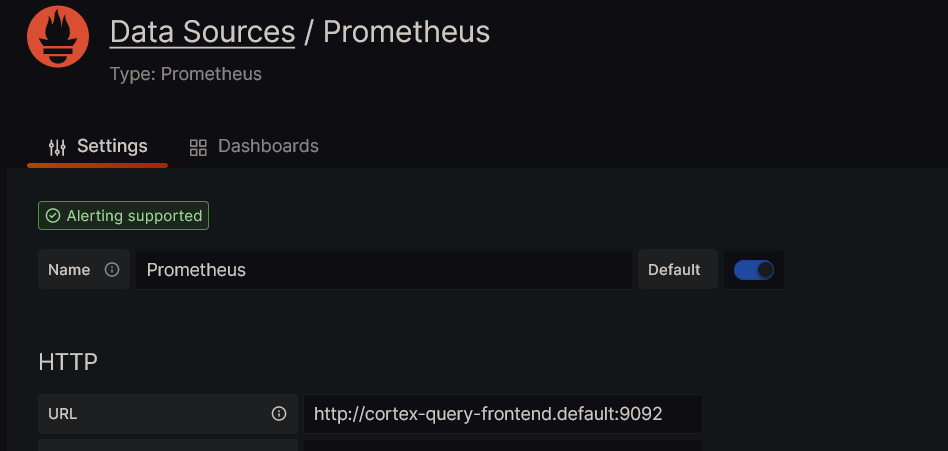
Configuration of query frontend
Let’s look at the configuration of query frontend. The configuration is stored in a configmap named cortex-query-frontend-config. You can view the data of configmap by running:
kubectl get configmap cortex-config -o jsonpath='{.data.*}'Now, let’s understand what each of these values means in the configmap specified :
auth_enabled: false
http_prefix:
server:
  http_listen_port: 9092
query_range:
  split_queries_by_interval: 24h
  cache_results: true
  results_cache:
    cache:
      enable_fifocache: true
      fifocache:
        max_size_bytes: 1GB
        validity: 24h
frontend:
  downstream_url: https://prometheus.demo.do.prometheus.io
auth_enabled : If set to true, enables the requirement that every request to Cortex has a X-Scope-OrgID header
http_prefix : Is set to empty by default. If it’s not specified, then the API prefix is set to /api/prom
server : Specifies the port on which Cortex query frontend listens for requests. By default, it is set to 9092.
split_queries_by_interval : If specified, Cortex query frontend splits queries by the specified interval. This is useful while running queries over a long time range. By default, it is set to 24h.
enable_fifocache : If set to true, enables the Fifo Cache (in-memory). By default, it is set to false. You can also use memcached as a cache.
max_size_bytes : Specifies the maximum size of the cache in bytes. Here it is set to 1GB. You can also specify the value based on your requirements. Once the cache reaches the specified size, the oldest entries are evicted.
validity : Specifies the expiry duration for the cache. Here it is set to 24h.
downstream_url : Specifies the URL of the downstream querier. Here it is set to the Prometheus server. You need to change this to the URL of your Prometheus server.
If neither fifocache.max-size-bytes nor fifocache.max-size-items is set, then the cache would not be created.
Note: As we’ve configured Fifo Cache, a restart of the query frontend pod will clear the cache. If you want to persist the cache, you can use memcached instead of Fifo Cache.
Id you’d like to use Memcached instead of Fifo Cache, you can use the config with the below format :
memcached:
  expiration : 24h
memcached_client:
  host: memcached.default.svc.cluster.local
  service: memcached
  addresses: ""
  consistent_hash: true
Validation of cache hits
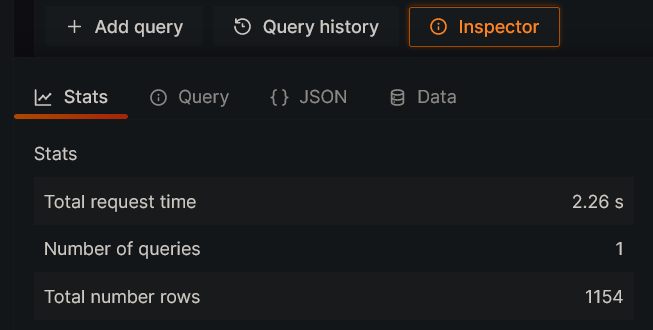
Let’s try to query the below data for the last 4 days with the Prometheus data source and check the response time.
  sum(rate(caddy_http_request_duration_seconds_bucket{le="0.25"}[5m])) by (job)
/
  sum(rate(caddy_http_request_duration_seconds_count[5m])) by (job)
As we can see from the screenshot below, the query took 2.26 seconds to execute.
You can run the same query again and check the response time. It will be around 2.2 seconds.
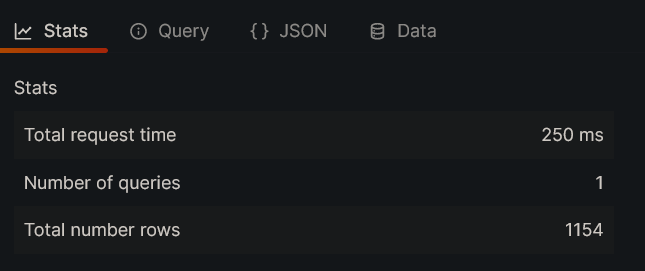
Now, try to query the same data with Cortex query frontend data source and check the response time. It will be around 2.2 seconds for the first time as the cache is not populated yet.
If you run the same query again, you can see that the response time is reduced to 250 milliseconds, which is nearly 10x faster. This is because the query result is cached and reused.
In reality, you won’t be querying the same data again always. In such cases, query frontend will calculate the required data which is not cached and execute the query in parallel on the downstream querier, and returns the result along with the cached result.
Say, for example from the above query, if you change the time range to the last 5 days, Query Frontend will query Prometheus for the fifth-day data and return the result along with the cached result for 4 days.
Metrics to keep track of cache hits
Cortex query frontend exposes metrics in Prometheus format at 9092/metrics. You can add a scrape job in your Prometheus server to scrape the metrics from Cortex query frontend, like :
- job_name: cortex-query-frontend
  scrape_interval: 60s
  static_configs:
  - targets:
    - cortex-query-frontend.default:9092
You can keep track of the cache hits and other cache-related metrics by using the below metrics :
querier_cache_memory_bytes : The total memory used by the cache in bytes.
querier_cache_stale_gets_total : The total number of cache calls(Get) that had an entry that expired.
querier_cache_misses_total : The total number of Get calls that had no valid cache entry.
querier_cache_gets_total : The total number of Get calls that had a valid cache entry.
There are a few other metrics related to cache. You can find them here.
Conclusion
In this article, we explored how to improve query performance in Existing Prometheus using caching with Cortex query frontend. We also looked at the configuration of Cortex query frontend and the metrics to keep track of cache hits. This can greatly benefit the dashboards that are consumed by multiple users and will also help reduce the load on the Prometheus server over multiple queries.
Reference :
https://github.com/cortexproject/cortex-helm-chart/
https://cortexmetrics.io/docs/configuration/prometheus-frontend/
https://github.com/cortexproject/cortex/blob/master/pkg/chunk/cache/fifo_cache.go
Aviator: Automate your cumbersome merge processes
Aviator automates tedious developer workflows by managing git Pull Requests (PRs) and continuous integration test (CI) runs to help your team avoid broken builds, streamline cumbersome merge processes, manage cross-PR dependencies, and handle flaky tests while maintaining their security compliance.
There are 4 key components to Aviator:
- MergeQueue – an automated queue that manages the merging workflow for your GitHub repository to help protect important branches from broken builds. The Aviator bot uses GitHub Labels to identify Pull Requests (PRs) that are ready to be merged, validates CI checks, processes semantic conflicts, and merges the PRs automatically.
- ChangeSets – workflows to synchronize validating and merging multiple PRs within the same repository or multiple repositories. Useful when your team often sees groups of related PRs that need to be merged together, or otherwise treated as a single broader unit of change.
- TestDeck – a tool to automatically detect, take action on, and process results from flaky tests in your CI infrastructure.
- Stacked PRs CLI – a command line tool that helps developers manage cross-PR dependencies. This tool also automates syncing and merging of stacked PRs. Useful when your team wants to promote a culture of smaller, incremental PRs instead of large changes, or when your workflows involve keeping multiple, dependent PRs in sync.