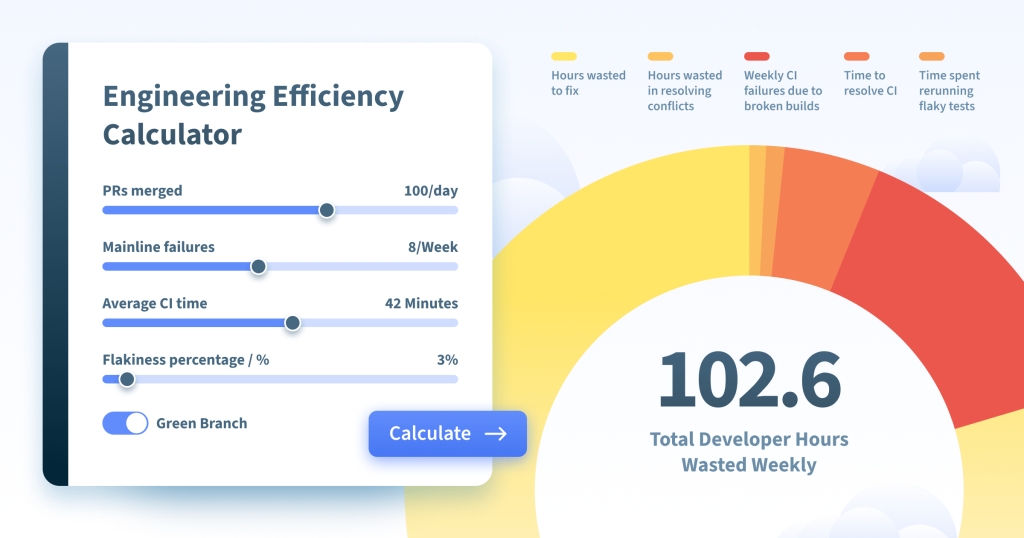
Introducing Aviator’s engineering efficiency calculator
A calculator that provides a glimpse of the “hidden pockets” of time wasted that typically do not show up in more common engineering productivity metrics.
https://app.aviator.co/calculator
Measuring engineering productivity is a complicated process — it’s hard to get a full picture of how developers spend their time. A common way to measure productivity is to analyze system metrics like DORA or SPACE. These can be extremely useful metrics to understand the productivity of the team compared to the industry standards. Diving into each of those metrics can also provide insights into what’s slowing down the team.
But sometimes there are also “hidden pockets” of time that developers spend throughout their day that may not be perceived as impacting productivity. However, when we start adding those things up the numbers can be alarming.
For instance, consider the amount of time a developer spends debugging a flaky test trying to figure out if it failed because of their change or not. Or, the time spent by a developer who is trying to resolve a mainline build failure.
To provide that perspective, we built a calculator that makes a run at assessing engineering efficiency. By no means does this provide a full analysis of your engineering team’s efficiency. What it does provide is a glimpse of the “hidden pockets” of time wasted that typically do not show up in more common productivity metrics. The calculator focuses on how much time you and your team lose due to build and test failures in developer workflows.
If you compare this to DORA metrics, the lead time for changes is significantly impacted by build and test instability. That impact can be assessed using this calculator.
How it works
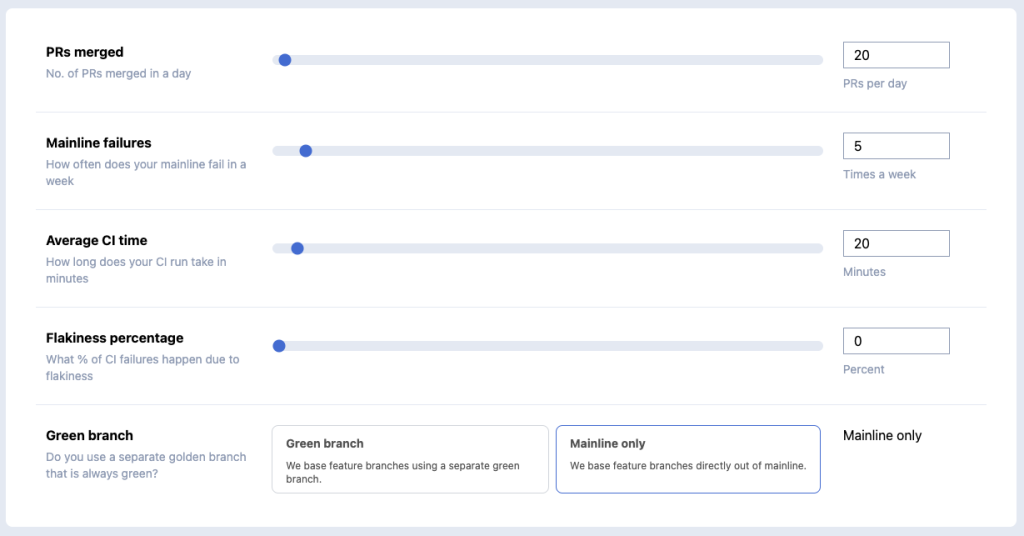
We ask you to input data based on your GitHub activities and how you use GitHub branches. To explain the actual calculations below, let’s assign variables to each of them:
M – PRs merged per day
X – mainline failures in a week
T – average CI time
F – flakiness factor %
Based on these inputs, we estimate how much time your engineering team wastes weekly on managing build failures and dealing with flaky tests. Let’s go over the results one by one.
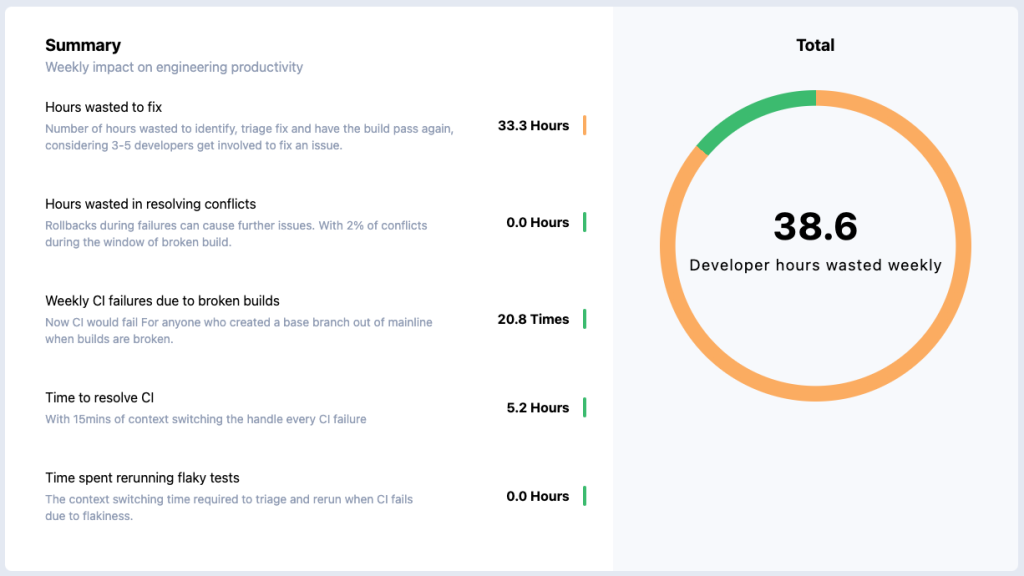
Hours wasted to fix
This calculates how many hours are wasted to identify, triage, fix, and have the build pass again when a mainline build failure is detected. Typically in a large team, someone will notice and report the broken mainline build.
We assume that a mainline build failure involves an average of 1-3 developers to debug and fix. If we consider an average of one hour for the time it takes for the issue to be reported and a fix to be pushed, we are spending (2*T + 1) hours to track, investigate, and resolve the issue.
That means, if there are X failures a week, we are spending ((2 devs * X/5 * (2*T + 1)) hours in developer time to fight mainline build failures every day.
Hours wasted in resolving merge conflicts
Rollbacks and merge conflicts can cause further issues. Assuming that there are roughly 2% PRs that have merge conflicts during the window of broken build time ((2*T + 1) * X/5), and M/8 PRs coming in every hour, we will spend ((2*T + 1) * X/5) * 0.02 * M/8 wasted in resolving these conflicts.
Weekly CI failures due to broken builds
If the team is not using a golden branch to base their feature branches on, they would likely create feature branches on top of a failed mainline branch. Since the number of PRs created during any time would be similar to the average number of feature branches based out of mainline, this would cause (2*T + 1 hour) * X/5 * M/8 number of CI failures happening every day.
Time to resolve CI
With approximately fifteen minutes of context switching the handle every build failure, that’s (2*T + 1 hour) * X/5 * M/8 * 0.25 hours of developer time wasted every day with CI failures.
Time spent rerunning flaky tests
Similarly, with the flaky tests, the context switching time required to investigate whether the test was flaky or real, and rerunning the tests itself takes an average of fifteen minutes per run. Depending on the flakiness factor, the developers would waste (0.25 * M * F / 100) hours every day.
Improving efficiency
Although most of these impact the DORA metrics associated with Lead time for changes, we are still just scratching the surface in terms of measuring the inefficiencies in engineering team workflows. The impact of build and test failures also leads to delayed releases impacting the other DORA metrics like deployment frequency, time to restore service, and persistence of flaky tests in the system can lead to a higher change Failure rate. Learn more about DORA metrics. Or, learn more about their disadvantages.
We built Aviator to solve some of these hidden challenges for large engineering teams. Today, using Aviator MergeQueue many engineering organizations can scale your merge workflow without breaking builds. Combining that with a flaky test suppression system like TestDeck, teams can save hundreds of engineering hours every week.